DugoutData
Automated youth baseball analytics covering the entire DFW regional market — 5 tournaments, 294 teams, ~5,900 box scores, refreshed nightly without a human touching a keyboard.
Flying blind across three tournament ecosystems.
Youth baseball coaches and parents in the DFW region were piecing rankings together by hand. Between spring tournaments, a team might play 15–20 games across Five Tool, Rocker B, TSB Classics — each with its own standings page, its own format, and zero connection to the others.
If a coach wanted to know how their 10U team actually ranked against the 70+ other teams in the region, they had to pull box scores off GameChanger, build their own spreadsheet, and do the math themselves.
Nobody did. They just guessed.
The ask was simple to say, hard to build: one place to see every team, ranked fairly, updated automatically, with enough context to actually trust the numbers.
One full-stack platform, zero ongoing manual work.
We built DugoutData — a full-stack analytics platform that automatically ingests live game data from GameChanger's API, processes it through a custom multi-factor ranking algorithm, and serves it through a clean, mobile-optimized web dashboard.
The architecture is lean by design:
- Python + Flask on the backend — fast to build, easy to maintain, easy to hand off.
- SQLite as the database — zero infrastructure overhead, zero cost, handles ~5,900 games without breaking a sweat.
- Automated scraping pipeline on a schedule that refreshes rankings without anyone touching a keyboard.
- Jinja2 templates with fully inline critical CSS — pages load fast even on a coach's 4G connection from a baseball field.
No third-party analytics SaaS. No monthly data fees. No manual exports. Just a system that runs itself.
Built to replace a spreadsheet — and a volunteer's Sunday night.
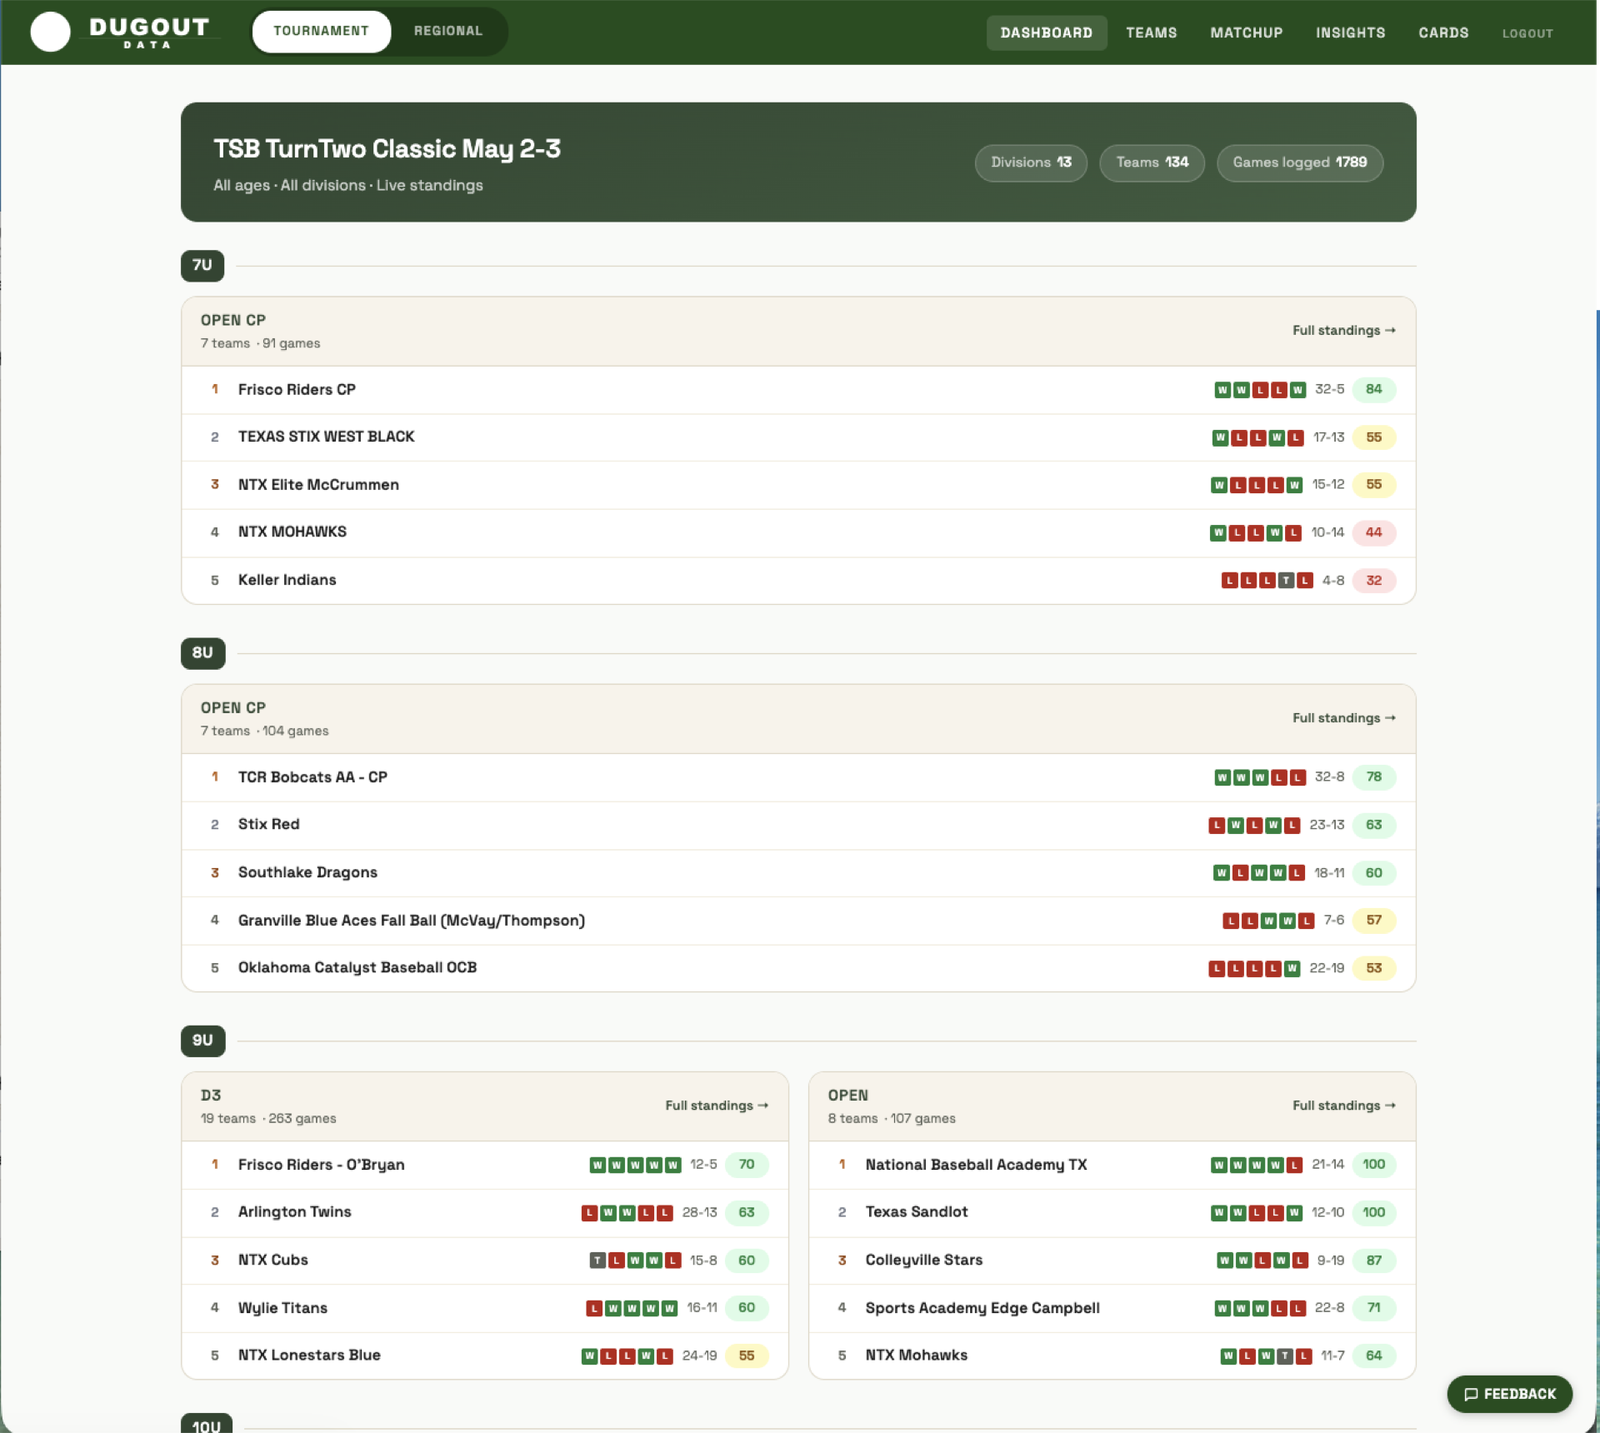
Nightly sweep of every team, zero manual work.
Scheduled job pulls latest box scores from the GameChanger API, parses batting and pitching lines at the individual player level, and recalculates standings automatically. 294 teams across 5 tournaments, updated every night.
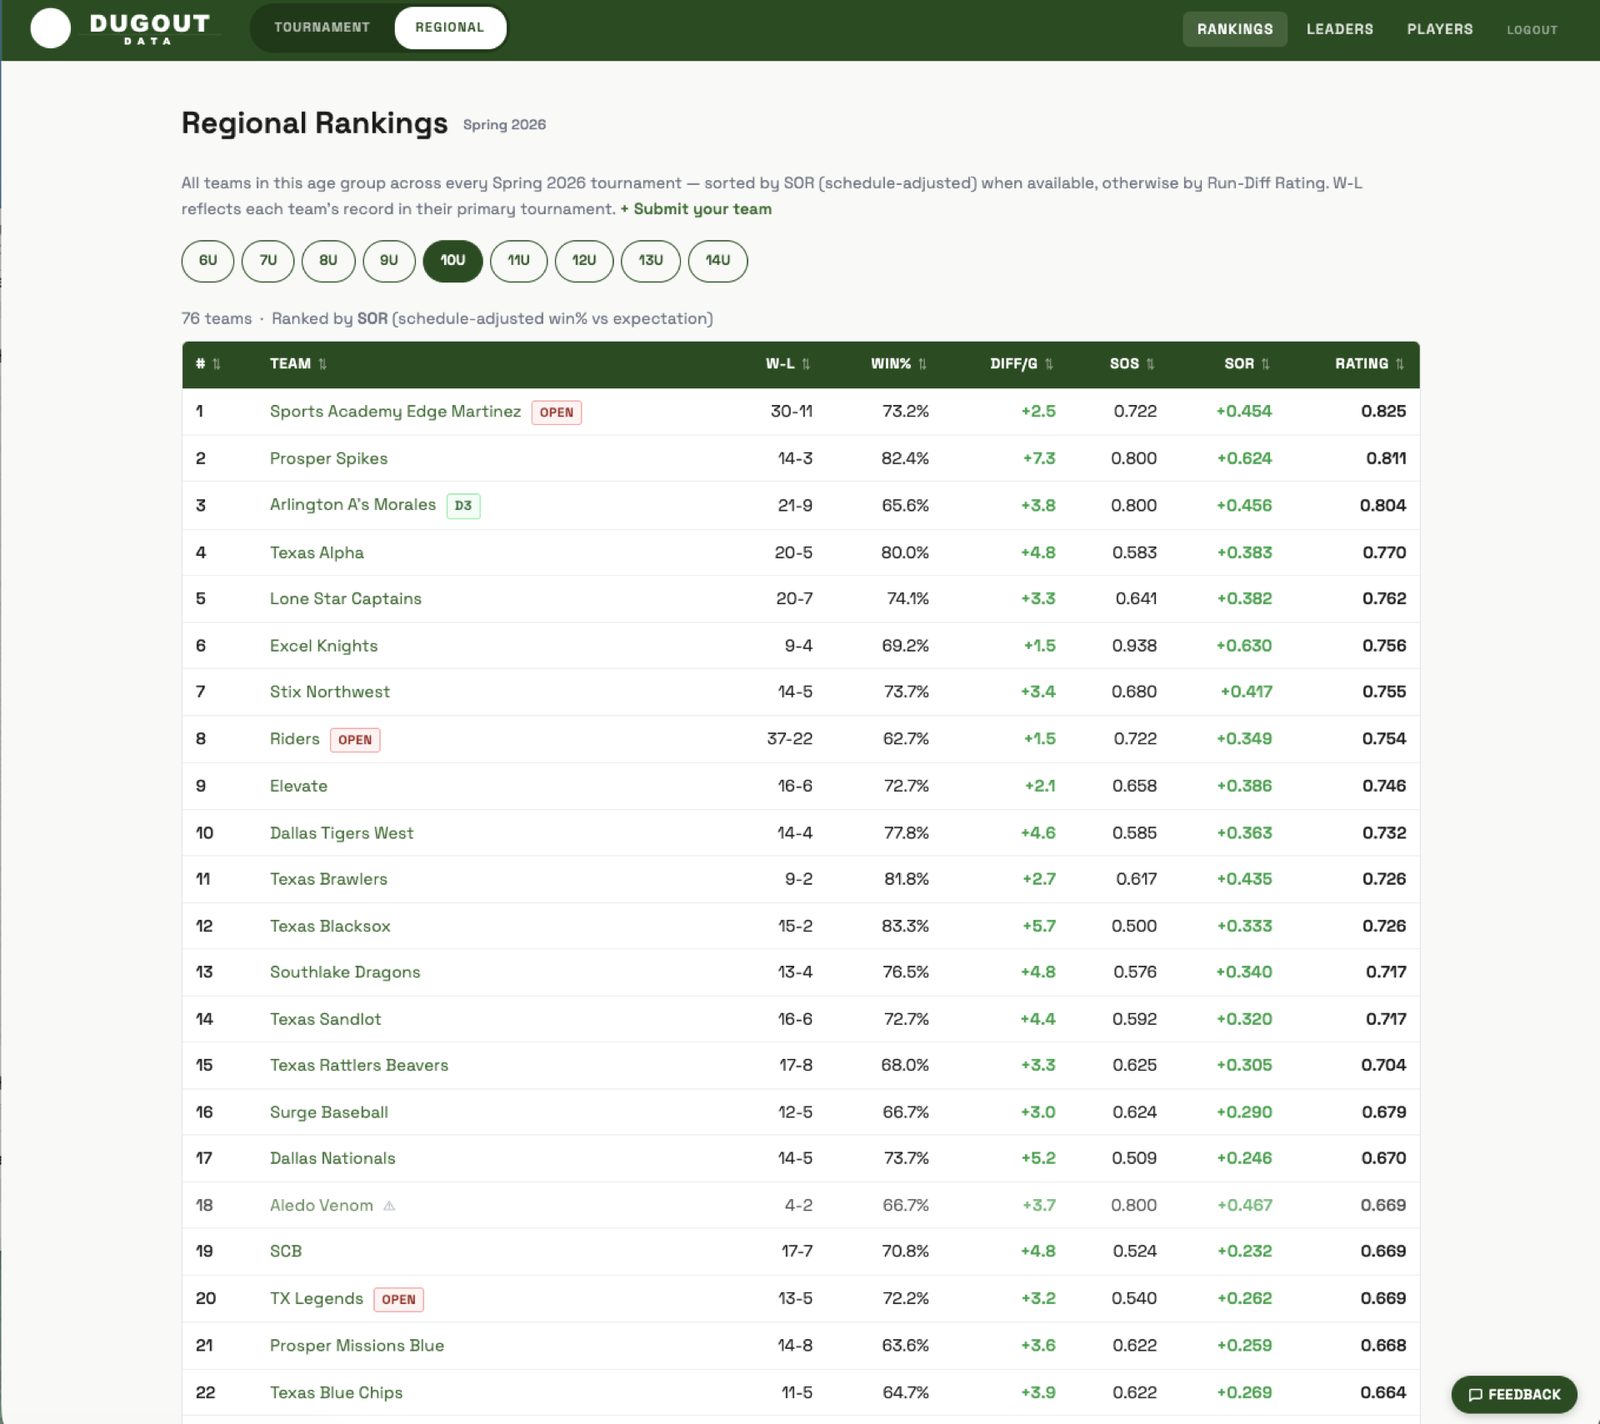
Replaces 30+ minutes of volunteer work per tournament refresh.Regional rankings that actually mean something.
Raw win-loss records lie. DugoutData's ranking system accounts for strength of schedule, strength of record, opponent quality tier (D1/D2/D3), and applies Bayesian confidence smoothing so teams with only 3 games don't unfairly dominate.
Coaches can trust the leaderboard because the math does the heavy lifting.Tournament bracket simulator.
Before a tournament starts, DugoutData runs 10,000 simulated bracket outcomes using each team's composite rating and outputs championship, finals, and semifinals probability for every team in the field.
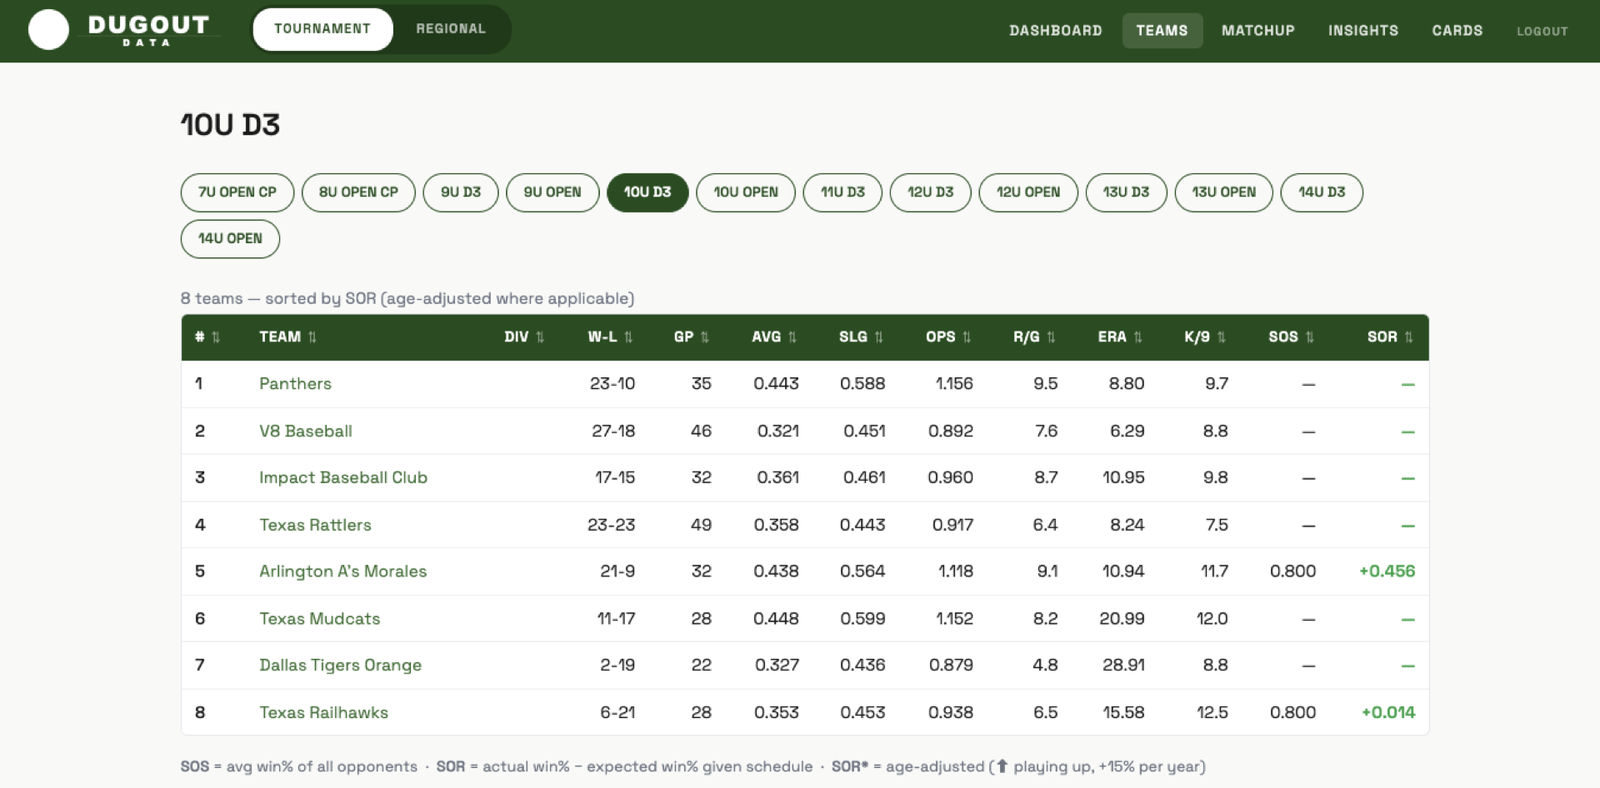
Builds excitement before the first pitch — no manual Excel hell.Scout your next opponent in seconds.
Every team page shows a full statistical profile: batting average, OPS, ERA, run differential, last-5 game form, half-season trend, and a plain-English archetype ("Pitching-First," "Sluggers," "Boom or Bust").
Understand an unfamiliar opponent's identity in under a minute.The data doesn't come easy.
GameChanger doesn't publish a public developer API. Accessing authenticated box score data required extracting a live JWT session token using a headless browser, decoding the token expiry, and proactively refreshing it mid-run before it expires mid-scrape. We built that session management layer from scratch.
The ranking algorithm runs three independent calculations — run-differential rating, raw Strength of Record, and schedule-adjusted SOR — then selects the most statistically trustworthy signal based on available data. Teams with small sample sizes are automatically blended toward a neutral baseline using Bayesian shrinkage, so a 3-game team doesn't rank above a 15-game team just because they got lucky.
Cross-tournament ranking required building a deduplication engine that identifies the same team appearing in multiple events, merges their records intelligently, and displays unified regional standings — something no individual tournament's native software even attempts.
The result is ~8,000 lines of Python doing work that would take a human analyst hours, in seconds, automatically.
Concept to live platform covering an entire regional market.
DugoutData went from concept to live platform covering the entire DFW youth baseball market, with a nightly automated pipeline that keeps every number current without human intervention.
Coaches get regional rankings they can trust. Parents get player stats they can reference. Tournament directors get a bracket simulator that builds excitement before the first pitch. And nobody has to touch a spreadsheet again.
Screenshots.
The project in the wild — UI from the live product.
Got a manual process eating your week?
If you can describe the work, we can probably automate it. Tell us what you're doing by hand — we'll tell you what it would take to stop.
Start a Conversation